Grain Size Analysis by Wet and Dry Sieve Analysis
1. objective
2. apparatus required
|
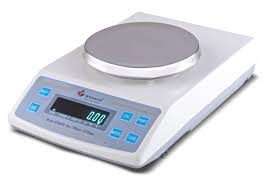
Fig. 1: BalanceThe balance to be used must be sensitive to the extent of 0.1% of total weight of sample taken. |

|
Fig. 2: SieveI.S sieves (100 mm, 75 mm, 19 mm, 4.75 mm, 2.00 mm, 0.425 mm and 0.075 mm). I.S 460-1962 to be referred. The sieves set should have lid at top and Pan at base. |

|
Fig. 3: Sieve ShakerMechanical Sieve Shaker |
|
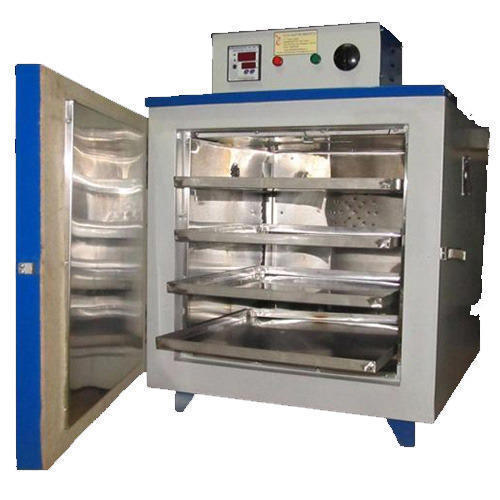
Fig. 4: OvenThermostatically Controlled Hot Air Oven to maintain Temperature between |
|
Fig. 5: TraysTwo or more large metal or plastic water tight trays or a bucket about 30 cm in diameter and 30 cm deep (sizes of the trays are in the range of 45 to 90 cm2 and 8 to 15cm deep). |

|
Fig. 6: Wire Brush |
3. reference
4. procedure
1) The soil fractions retained on and passing 4.75mm Sieve shall be taken separately for the analysis. Dry the soil sample in a Thermostatically Controlled Hot Air Oven at 105 to 110 0C.
2) Weigh the portion of the soil sample retained on 4.75mm Sieve and record the mass. The quantity of the soil sample to be taken for the test should be as per Table 1 & 2 given below:
| Maximum size of material present in substantial quantities | Weight to be taken for test |
|---|---|
| 75 mm | 60 kg |
| 40 mm | 25 kg |
| 25 mm | 13 kg |
| 19 mm | 6.5 kg |
| 12.5 mm | 3.5 kg |
| 10 mm | 1.5 kg |
| 6.5 mm | 0.75 kg |
| 4.75 mm | 0.40 kg |
| IS Sieve Designation | 450 mm Dia. Sieves (in kg) | 300 mm Dia. Sieves (in kg) |
|---|---|---|
| 80 mm | 15 kg | 6 kg |
| 20 mm | 4 kg | 2 kg |
| 4.75 mm | 1.0 kg | 0.5 kg |
| 2 mm | -- | 0.20 |
| 425 micron | -- | 0.050 |
| 75 micron | -- | 0.025 |
3) Sieve the sample through the sieve net of size 4.75mm and higher. Other sieves may be introduced in between the sieves, depending upon the additional information desired to be obtained. The sieves shall be agitated and any particles may be tested to see if they will fall through, but they shall not be pushed through. The quantity taken each time for sieving shall be such that the maximum weight retained on each sieve does not exceed the values given in Table 2.
4) Record the mass retained on each sieve. If the sample appears to contain over 5% moisture, the water content shall be determined and the masses corrected accordingly. If the soil contains more than about 20% gravel particles and the fines are very cohesive with considerable amounts adhering to the gravel after separation, the gravel shall be washed on 4.75mm Sieve using sodium hexametaphosphate solution.
5) The portion of soil passing 4.75mm Sieve shall be oven-dried at 105 to 115°C. Weigh this soil mass to accuracy of 0.1% of its total mass and record the mass. Spread out this material in large tray or bucket and cover with water.
6) Wash the soaked soil specimen on 75 micron sieve until the water passing is substantially clean. The fraction retained on the sieve should be tipped in a tray, dried in the oven and sieved through the nest of 2mm, 425 micron and 75 micron sieves. The fraction retained on each sieve should be weighed separately and the masses recorded.
5. observation and recording
| I.S Sieve Number/Size (mm) | Wt. retained in each Sieve (gm) | Percentage retained on each sieve | Cumulative percentage retained on each Sieve | % Finer |
|---|---|---|---|---|
| 100 | ||||
| 75 | ||||
| 19 | ||||
| 4.75 | ||||
| 2.00 | ||||
| 0.425 | ||||
| 0.075 | ||||
| PAN |
6. calculation
1)The percentage of soil retained on each sieve shall be calculated on the basis of total weight of soil sample taken. Then, cumulative percentage of soil retained (which will give % finer when deducted from 100) on successive sieve is found.
2)Plot a graph on log scale with "Particle size (Diameter)" on X- axis & "Percent finer" on Y- axis. The graph is known as grading curve (Fig. 7). Corresponding to 10%, 30% and 60% finer, obtain diameters from graph, which are designated as D1O, D30 and D60.
3) Calculate the Coefficient of Uniformity (Cu) and the Coefficient of Curvature (Cc) using the following equations:
Cu = D60/ D10
Cc= D302/(D60 x D10)
7. General Remarks
In the case of clayey soils, dry sieving shall not be used and wet sieving shall be used.
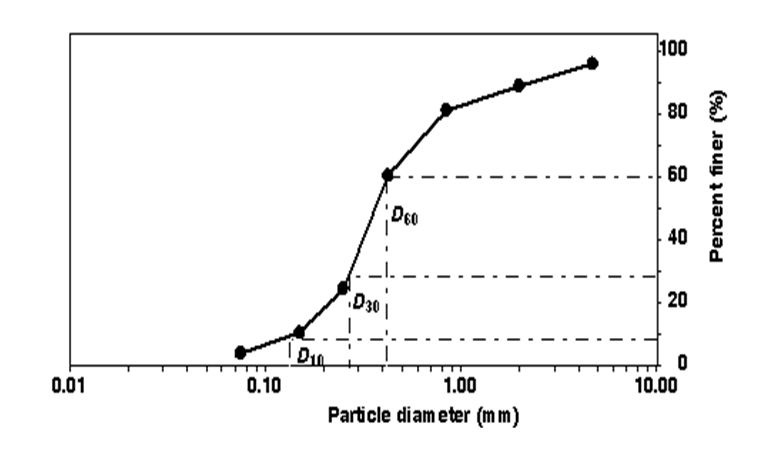
Fig. 7 : Plot of Percent Finer vs. Particle Diameter

Fig. 8: General nature of grain-size distribution of well graded, poorly graded and gap graded soil
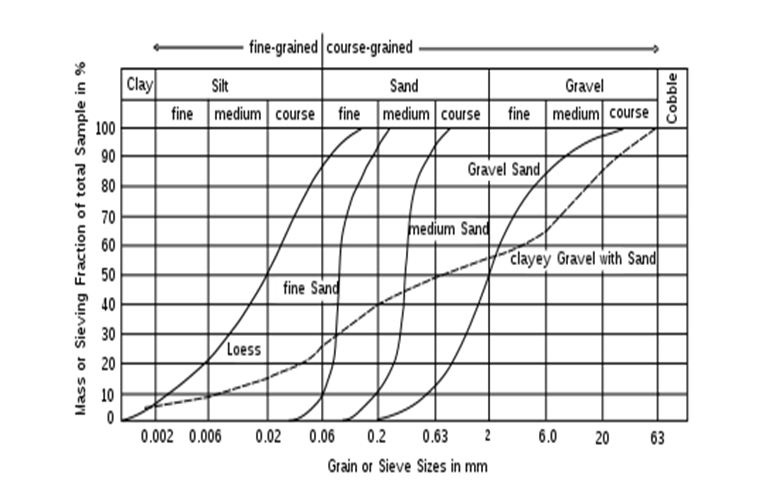
Fig. 9 : Soil Classification based on percent finer vs. grain size