Grain Size Analysis by Hydrometer
1. objective
2. apparatus required

|
Fig. 1: HydrometerCalibrated at 27°C, range of 0.995 to 1.030 g/cc, graduation lines at interval of 0.0005; in conformity with IS-3104: 1965. The maximum permissible scale error on the hydrometer is plus or minus one scale division. |

|
Fig. 2: Laboratory setup for Hydrometer TestTwo 1000 ml graduated cylinders, Dispersing agent solution containing sodium hexa-metaphosphate, Mechanical stirrer, Water Bath, Balance, Sieve, Dessicator and Centimetre Scale. |

|
Fig. 3: Porcelain Evaporating Dish |

|
Fig. 4: ThermometerFor measuring Temperature required for Temperature corrections- with accuracy of 0.50 C |

|
Fig. 5: Stop WatchFor recording Time interval. |
3. reference
IS-2720 (Part 4):1985 (Reaffirmed- May 2020) “Methods of test for soils: Grain size analysis”.
4. procedure
-
Determination of volume of the hydrometer bulb (Vh): Pour about 800 ml of water in the 1000 ml
measuring cylinder and note the reading at the water level. Immerse the hydrometer in water and
note the water reading. The difference between the two readings is recorded as the volume of the
Hydrometer bulb plus the volume of that part of the stem which is submerged. For practical purpose
the error due to the inclusion of this stem volume may be neglected.
Alternatively, weigh the hydrometer to the nearest 0.1g. This mass in grams is recorded as the volume of
the hydrometer in ml. This includes the volume of the bulb plus the volume of the stem below the 1.000 graduation mark.
-
In order to find the area of cross-section (A) of the measuring cylinder in which the hydrometer is be used, measure the distance, in cm,
between two graduations of the cylinder. The cross-sectional area (A) is then equal to the volume included between the two graduations divided
by the distance between them. Record it in cm2
-
Measure the distance (h) from the neck to the bottom of the bulb, and record it in cm as the height of the bulb.
-
With the help of an accurate scale, measure the height between the neck of the hydrometer to each of the other major calibration marks i.e.,Rh in cm (H).
For convenience, the hydrometer readings (Rh) ae recorded after subtracting 1 and multiplying the remaining digits by 1000. For example, the reading of 1.015
will be recorded as (1.015-1)*1000 = 15.
-
Calculate the effective depth (He) corresponding to each of the calibration marks (or hydrometer readings, Rh)
by the following expressions:
He = H + 0.5 (h – Vh/A)
NOTE : The factor Vh/A) in the above equation shall not be applied to hydrometer reading after period of sedimentation of half, one, two and four minutes.
-
The readings may be recorded as illustrated in Table 1:
-
Draw a calibration curve between He and Rh which may be used for finding the effective depth (He) corresponding
to hydrometer readings (Rh) during test.
-
Meniscus correction:
Insert the hydrometer in the measuring cylinder containing about 700 ml of water. Take the readings of the hydrometer at the top and bottom of the meniscus. The difference between two readings is taken as meniscus correction (Cm) which is a constant for a hydrometer. During the actual sedimentation test, the readings should be taken at the bottom of the meniscus but since the soil suspension is opaque, readings are taken at the top of meniscus, It is clear that readings decrease in the upward direction. Thus, the observed hydrometer readings are always less than the true one. Hence the meniscus correction is always positive.
-
Pre-treatment of soil:
The percentage of soluble salts shall be determined. In case it is more than one percent, the soil shall be washed with water before further treatment.
4.1 Calibration of Hydrometer
| S. No. | Hydrometer Reading, Rh | H (cm) | Effective depth, He (cm) |
|---|---|---|---|
| 1 | |||
| 2 | |||
| 3 |
Table 1
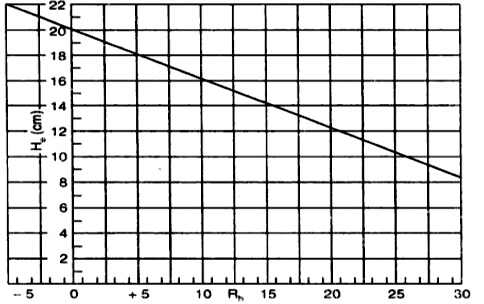
Fig. 6 : Calibration Curve for Hydrometer
-
In the case of soils containing Calcium compounds or soluble salts and having organic content more than 2 percentage, the soil shall be
pre-treated as below :
Weigh 50 to 100g of oven-dried soil sample (Ma) passing the 4.75 mm IS Sieve to nearest 0.01 g (50g for clay soil and 100g if it is a sandy soil) and place it in a wide mouthed conical flask. Add 150 ml of hydrogen peroxide to the soil sample and stir it gently for few minutes with a glass rod. Cover the flask with glass and level it to stand overnight.
Next morning, the mixture in the conical flask is gently heated in an evaporating dish, stirring the contents periodically. Reduce the volume to 50 ml by boiling. Place the dish and its contents to the oven. Filter and wash the mixture with warm water, until the filtrate shows no acid reaction to litmus. Transfer the damp soil on filter paper and funnel to the evaporating dish using a jet of distilled water, using minimum quantity of distilled water. Dry the contents of dish in oven at 105-1100C. Transfer them to desiccator and cool them. Weigh them to 0.01 g (Mb) and use for further testing.
-
Add 100 ml of sodium hexametaphosphate solution to the soil from step-1 above or otherwise (of mass Mb) from the soil passing 4.75 mm sieve and warm the mixture gently
for about 10 minutes. Transfer the mixture to the cup of the mechanical mixer using a jet of distilled water and stir it well for about 15 minutes. Transfer the soil suspension to
the 75 micron IS sieve placed on a receiver and wash the soil on this sieve using jet of distilled water from a wash bottle. The amount of distilled water used during this operation
may be about 150 ml. Stir the suspension for about 15 minutes.
Transfer the soil suspension to 75 micron IS Sieve and wash on this sieve using a jet of distilled water from wash bottle. The amount of distilled water used may be about 500 ml. Transfer the suspension passing through the sieve to 1000 ml measuring cylinder and make up to exactly 1000 ml using distilled water. This suspension shall be used for sedimentation analysis..
Collect the material retained 75 micron sieve and put it in the Oven for drying. Determine the dry mass of soil retained on 75 micron sieve.
4.2 Dispersion of Soil
-
Insert a rubber ball or any other suitable cover on the top of the 1000 ml measuring cylinder containing the soil suspension and shake it
vigorously end over end. Stop shaking and allow it to stand. Immediately, start the stop watch, and remove the top cover from the cylinder.
-
Immerse the hydrometer gently to a depth slightly below its floating position and then allow it to float freely. Take the hydrometer readings
after periods of 1/2, 1, 2 and 4 minutes. Take out the hydrometer, rinse it with distilled water and allow it to stand in a jar containing distilled
water at the same temperature as that of the test cylinder.
-
The hydrometer is re-inserted in the suspension and readings are taken after periods of 8, 15 and 30 minutes; 1, 2 and 4 hours after shaking.
The hydrometer should be removed, rinsed and placed in the distilled water after each reading. After end of 4 hours, readings should be taken
once or twice within 24 hours, the exact periods of sedimentation being noted.Finally take a reading at 24 hours.
-
Composite correction:
In order to determine the composite correction, make up a 1000 ml cylinder full of distilled water containing the same proportion of dispersing agent. The cylinder should be maintained at the same temperature as that of the test cylinder containing soil specimen. Insert the hydrometer in this comparison cylinder containing distilled water and the dispersing agent and take the reading corresponding to the top of the meniscus. The negative of the hydrometer reading so obtained gives the composite correction (C). The composite correction is found before the start of the test, and also at every time intervals of 30 minutes, 1 hour, 2 hours and 4 hours after the beginning of the test, and afterwards, just after each hydrometer reading is taken in test cylinder.
-
The temperature of the suspension should be observed and recorded once during the first 15 minutes and then after every subsequent reading.
4.3 Sedimentation test with hydrometer
5. Diameter of particles (in Millimeters)
D = √ ((30 μ)/(980(G-G1))* √ ((He/t))
Where, μ = Coefficient of viscosity of water at the temperature of suspension, at the time of taking hydrometer reading (in poise) as below :
| Temp, (0C) | μ (in poise) | Temp, (0C) | μ (in poise) | Temp, (0C) | μ (in poise) |
|---|---|---|---|---|---|
| 15 | 0.01145 | 25 | 0.00896 | 35 | 0.00721 |
| 16 | 0.01116 | 26 | 0.00875 | 36 | 0.00706 |
| 17 | 0.01088 | 27 | 0.00855 | 37 | 0.00692 |
| 18 | 0.01060 | 28 | 0.00836 | 38 | 0.00679 |
| 19 | 0.01034 | 29 | 0.00818 | 39 | 0.00666 |
| 20 | 0.01009 | 30 | 0.00800 | 40 | 0.00654 |
| 21 | 0.00984 | 31 | 0.00783 | ||
| 22 | 0.00961 | 32 | 0.00767 | ||
| 23 | 0.00938 | 33 | 0.00751 | ||
| 24 | 0.00916 | 34 | 0.00736 |
G = Specific Gravity of soil used
G1= Specific Gravity of water (=1)
He = Effective depth corresponding to Rh (in cm)
t = Time elapsed between the beginning of sedimentation and hydrometer
reading (in Minutes)
The hydrometer reading corrected for meniscus (Rh) shall be calculated from the following formula :
Rh = Rh' + Cm
Where, Rh’ = Hydrometer reading at the upper ring of meniscus
Cm = Meniscus Correction
6. Observation and Recording
 Table 2: Determination of Grain Size by Hydrometer

Fig. 7 : Particle Size Distribution Curve
7. Percentage finer than D
-
The percentage by Mass (W) of particles smaller than corresponding equivalent particle diameters shall be calculated from the formula :
W = {(100* G) / (Mb(G-1))} (Rh – C)
Where,G = Specific gravity of soil
Mb = Weight of soil after pre-treatment, used for
Rh = Hydrometer reading corrected from meniscus
C = Composite correction
The values of W shall be calculated for all the values of D obtained and shall be expressed as percentage of particles finer than the corresponding value of D.
These percentages shall then be expressed as combined percentage of the total soil sample taken for analysis (including sieve analysis):
N = W * (Ma/Mb)
Where, Ma = Total dry mass of the soil sample, passing 4.75 mm Sieve
Mb = Mass of soil sample, out of Ma, taken for hydrometer analysis.8. General Remarks
-
Sodium hexametaphosphate has been found to ineffective when dealing with certain highly flocculated soils. In such cases dispersion may be
carried out by adding N-sodium hydroxide solution at the rate of 4 ml per 10 g of soil.
-
The suspension should be kept out of direct sunlight and away from any local source of heat. Evaporation should be retarded by keeping
a cover on the measuring cylinder between the readings.
-
The specific gravity should he determined for the fraction of the sample passing 75 micron sieve.
-
This method shall not applicable if less than 10% of the material passes the 75 micron IS Sieve.
-
Sodium hexametaphosphate has been found to ineffective when dealing with certain highly flocculated soils. In such cases dispersion may be
carried out by adding N-sodium hydroxide solution at the rate of 4 ml per 10 g of soil.